ESP32 / ESP8266 Arduino Tutorial:2. Debugging with the ArduinoTrace library
Introduction
In this tutorial we will learn how to get started using ArduinoTrace, a tracing library that is aimed at debugging Arduino programs.
This library was created by Benoît Blanchon, which is also the author of ArduinoJson, an awesome JSON library that, amongst many other devices, supports the ESP32 and the ESP8266.
The ArduinoTrace library can be installed via the Arduino IDE library manager, as shown below in figure 1.

Figure 1 – Installing the ArduinoTrace library using the IDE library manager.
This library adds two very useful macros for debugging: TRACE and DUMP [1]. In this tutorial we will cover the DUMP macro, which receives as input a variable and outputs the following information to the serial port [1]:
- Filename
- Line number
- Variable’s name
- Variable’s value
Note that this is a library aimed at debugging, which means it impacts performance and makes the code slower [1]. Thus, this should only be used for debugging purposes and not in production code [1].
One interesting thing about this library is that it is implemented in a single header file and it has less than 100 lines of code [1].
As we will see below, this library is extremely simple to use. Although there are other debugging techniques available, printing some simple debugging messages has always been done by programmers as a way of finding the cause of problems in code. Thus, the mentioned macros make our life easier by adding some extra information for free to out debugging prints.
The tests on the ESP32 were performed using a DFRobot’s ESP-WROOM-32 device integrated in a ESP32 FireBeetle board. The tests on the ESP8266 were performed on a DFRobot’s ESP8266 FireBeetle board.
The code
The first thing we need to do is including the previously installed ArduinoTrace.h library, so we can have access to the DUMP macro.
#include "arduinotrace.h"
After that, we can move to the Arduino setup. There, we will start by opening a serial connection, so the library can output the tracing results.
Serial.begin(115200);
Now we are going do declare a variable and assign it a value. This will be the variable that we will use to test the DUMP macro.
int testVar = 10;
Then, we will call the DUMP macro, passing as input our variable. As already mentioned, this should output, amongst other information, the name of the variable and its current value.
DUMP(testVar);
To complete our test, we will assign a new value to the variable and call again the DUMP macro, to confirm that the second message printed to the serial port will have the updated value.
testVar = 20;
DUMP(testVar);
The final code can be seen below. As mentioned, the DUMP macro will also print the line where it is being called. As can be seen in the complete code, the first call is made on line 8 and the second on line 11.
#include "ArduinoTrace.h"

void setup() {

  Serial.begin(115200);

  int testVar = 10;
  DUMP(testVar);

  testVar = 20;
  DUMP(testVar);

}

void loop() {}
Testing the code
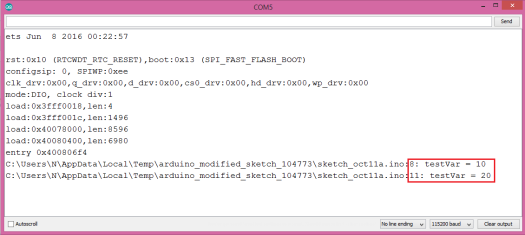
To test the code, simply compile it and upload it to your ESP device. Once the uploading procedure finishes, open the Arduino IDE serial monitor. You should get an output similar to figure 2.

Figure 2 – Output of the program, with the tracing messages.
As can be seen, the files where the DUMP was called are printed. Although for this simple example this may seem unnecessary because we are using a single file, it becomes very useful when debugging code included from multiple source files.
Additionally, we can confirm that the correct lines of the file where the DUMP macro was called are printed: 8 and 11. Also, the name of the variable and its values are outputted, as expected.


