Forum >Arduino Power Meter Open-source Kit
Arduino Power Meter Open-source Kit
 xjme 2014-06-11 21:46:24 8029 Views0 Replies
 1 Introduction
Google has done an open-source project about power meter. A study shows that paying attention to power consumption will bring energy reduction by 10-15%. Perhaps these saved energy costs make no change to your life, but if many people pay attention to power consumption, the energy savings will not be a small figure.
A lot of people have done the open source power meter with Arduino, such as
http://openenergymonitor.org/emon/node/58
However, they basically use independent current sensor and voltage sensor to complete the task, using Arduino to read the values of current and voltage, and then calculate the power.
The advantages are: The prices of the current sensor and voltage sensor are very cheap.
The disadvantages are: The power is calculated by the Arduino. If the power of Arduino is cut off, the data are lost. If you need to calculate the energy, you should use Arduino to do integral operation of the power, bringing accumulated error.
Because of these above problems, we use a special power meter module and an Arduino together to calculate electricity energy.
Arduino Power Meter Hardwares
l Arduino UNO+W5100
l URAT-RS485 module
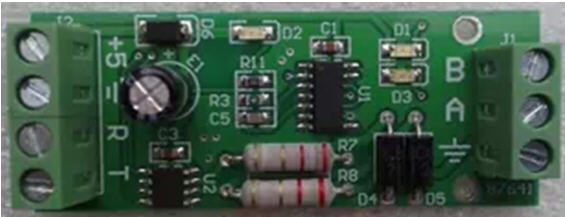
l JSY-109
(Power Meter Module, measuring the current, voltage, power, power consumption independently, and the data can no be lost if the electricity is cut off.)
[img]
[img]http://static.lewei50.com/UserFiles/WIF ... Snap52.jpg[/img]
[img]
Tutorial (Step by Step)
Wire Connection
As the following picture shows:
1. Air Switch at the entrance
2. Current transformer coil of power meter module, clipped on the dfrobot wire of the air switch. Please note the current direction.
3. Voltage transformer of power meter module, connected to 220V power supply (The red light is on if the power is supplied.)
4. TTL-RS485 Module, AB terminal is connected to 485 AB of power meter module.
5. TTL-RS485, TX RX 5V GND is connected to ARDUINO UNO
6. Select UNO with network board (W5100)
[img]http://static.lewei50.com/UserFiles/WIF ... Snap54.jpg[/img]
Download Codes
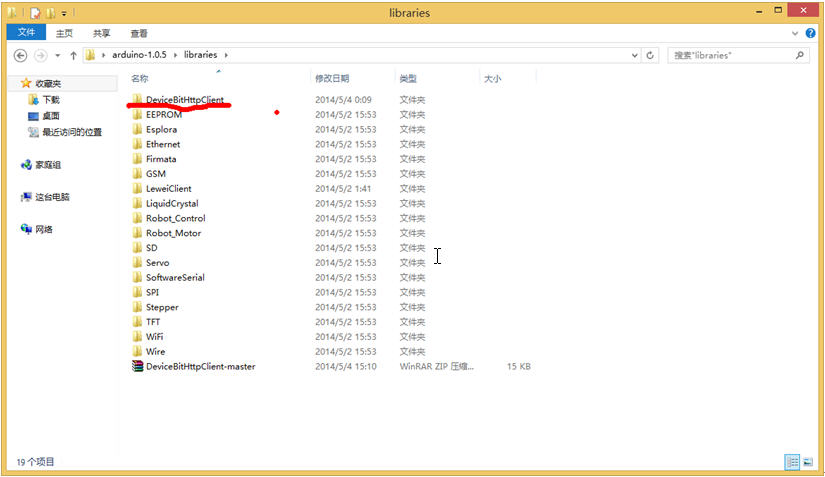
https://github.com/DevicebitDemo/DeviceBitHttpClient
Download this file to x/Arduino/library (Delete master in the file name)
[img]http://www.devicebit.com/userfiles/WIFI ... Snap67.jpg[/img]
Test for local mode
1. Open Arduino IDE
2. Example -> DeviceBitHttpClient ->JSY109local
3. Compile the codes (Note: Before downloading the codes, disconnect the TX pin and RX pin which connect TTL-RS485 module and the Arduino. Otherwise, the Arduino can not communicate with the power meter. )
4. Close the air switch, and the power is supplied to the power meter. The red light is on.
5. Open the monitor interface of the serial port, and select 4800 baud rates (Because the baud rates of power monitor module is 4800.) The voltage has been tested out, which means the communication between UNO and power meter module is normal.
[img]http://static.lewei50.com/UserFiles/WIF ... Snap56.jpg[/img]
Test for network
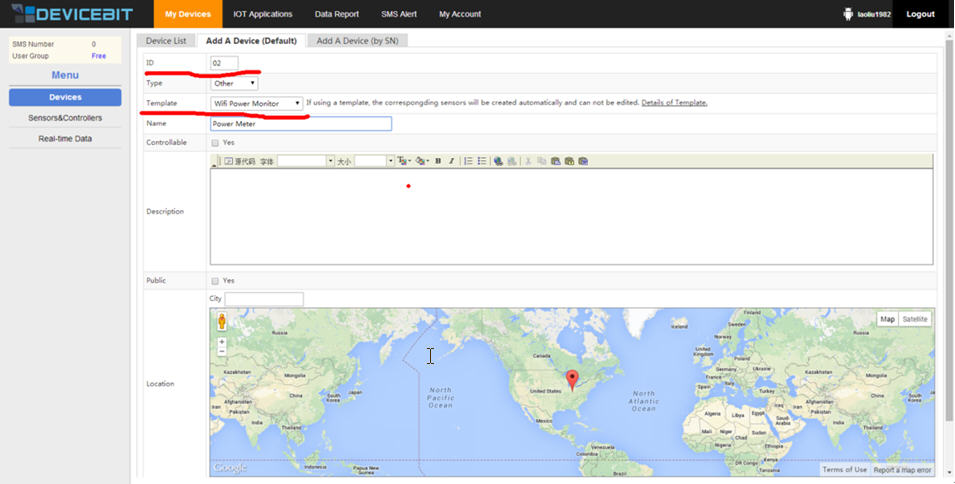
First, please register an account on http://www.devicebit.com/home/login
Then, login to devicebit, and add a new device. Note that the ID of the device is 02 (corresponding with the Arduino program). Template: select Wifi Power Monitor.
[img]http://www.devicebit.com/userfiles/WIFI ... Snap63.jpg[/img]
Open Arduino IDE
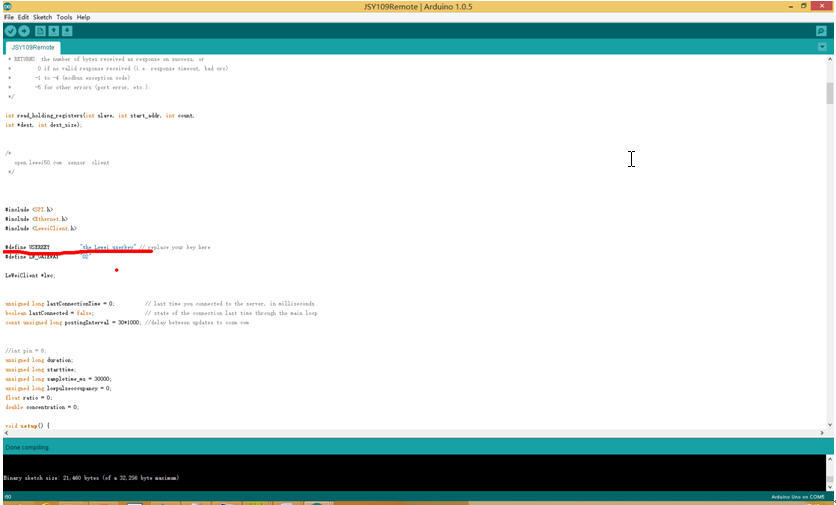
Example ->DeviceBitHttpClient->JSY109Remote?replace DB_USERKEY with your userkey.
[img]http://[/img]
[img]http://static.lewei50.com/UserFiles/WIF ... Snap58.jpg[/img]
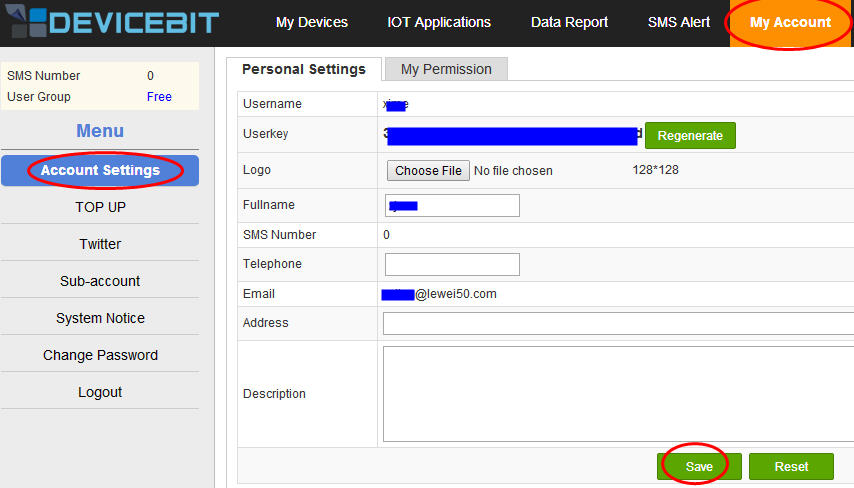
Get your userkey in the user center of DeviceBit My account->Account settings
[img]http://www.devicebit.com/UserFiles/usermanual/17-1.jpg[/img]
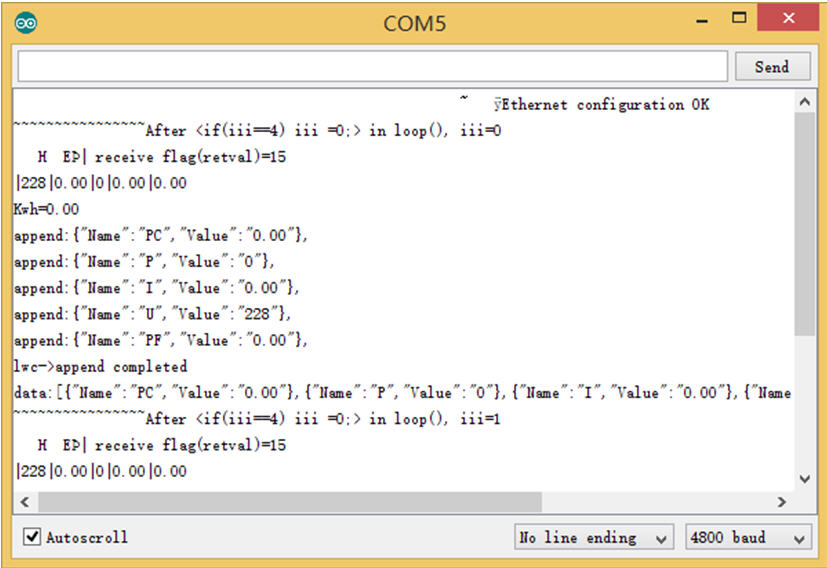
Compile the codes (Note: Before downloading the codes, disconnect the TX pin and RX pin which connect TTL-RS485 module and the Arduino. Otherwise, the Arduino can not communicate with the power meter. )
Open the monitor interface of the serial port, and select 4800 baud rates. When you see”Ethernet configuration OK”, the LAN configuration is done!
[img]http://static.lewei50.com/UserFiles/WIF ... Snap59.jpg[/img]
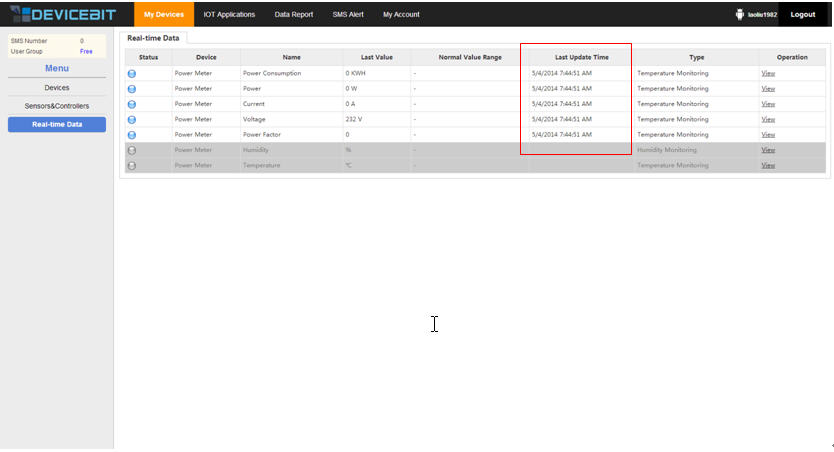
Go back to Real-time Data in the user center of DeviceBit, the sensors of power consumption, power, current, voltage and power factor have been highlighted and have data now(Note the last update time).
[img]http://www.devicebit.com/userfiles/WIFI ... Snap65.jpg[/img]
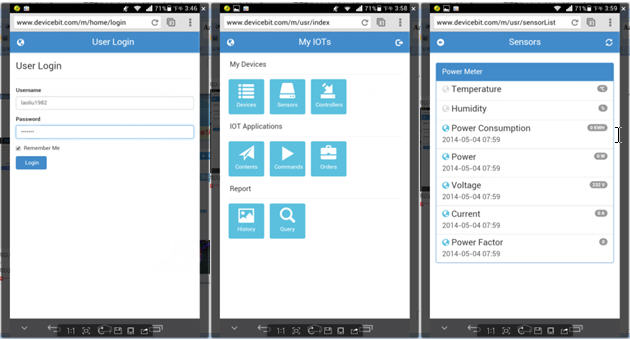
You can monitor the real-time data by visiting m.devicebit.com via your mobile phone
[img]http://www.devicebit.com/userfiles/WIFI ... Snap66.jpg[/img]
2 Data reports
DeviceBit platform provides basic data-analyzing tools so you can do a series of research based on your data stored in DeviceBit system.
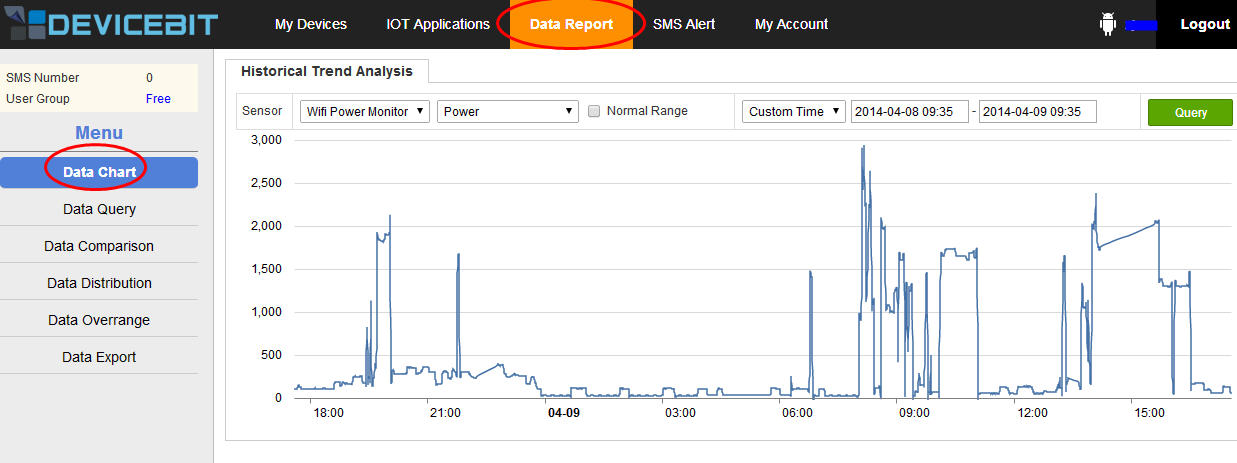
2.1 Data Chart
Go to Data Report ->Data Chart. You can right click on Query button to view the latest data curve. You can select the device and time period.
[img]http://www.devicebit.com/userfiles/WIFI ... Snap24.jpg[/img]
Data Chart
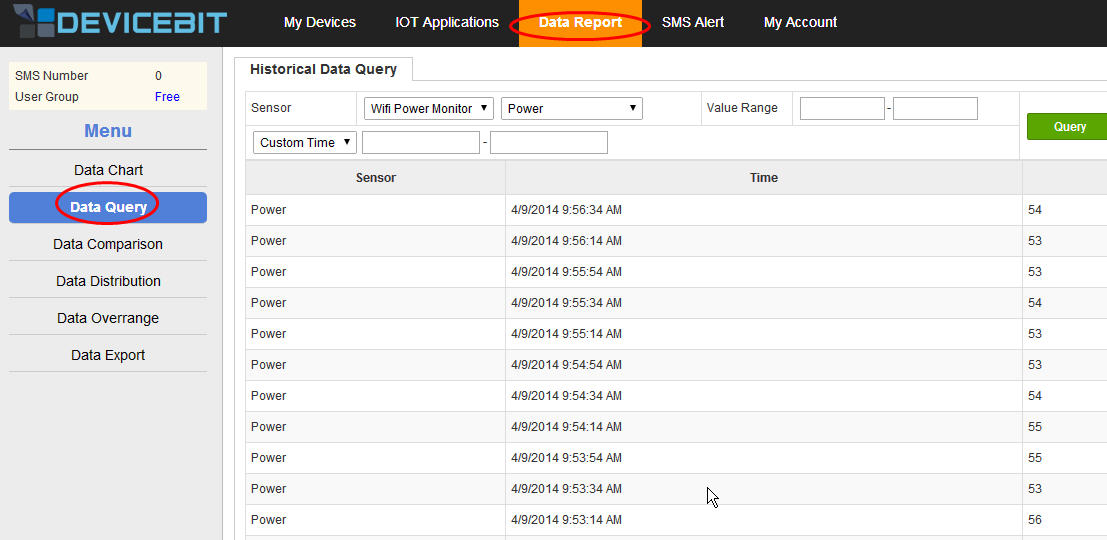
2.2 Data Query
You can also query the historical data by lists. Go to Data reports ->Data Query. You can select the device and other conditions. The data can be exported in Excel.
[img]http://www.devicebit.com/userfiles/WIFI ... Snap25.jpg[/img]
Data Query
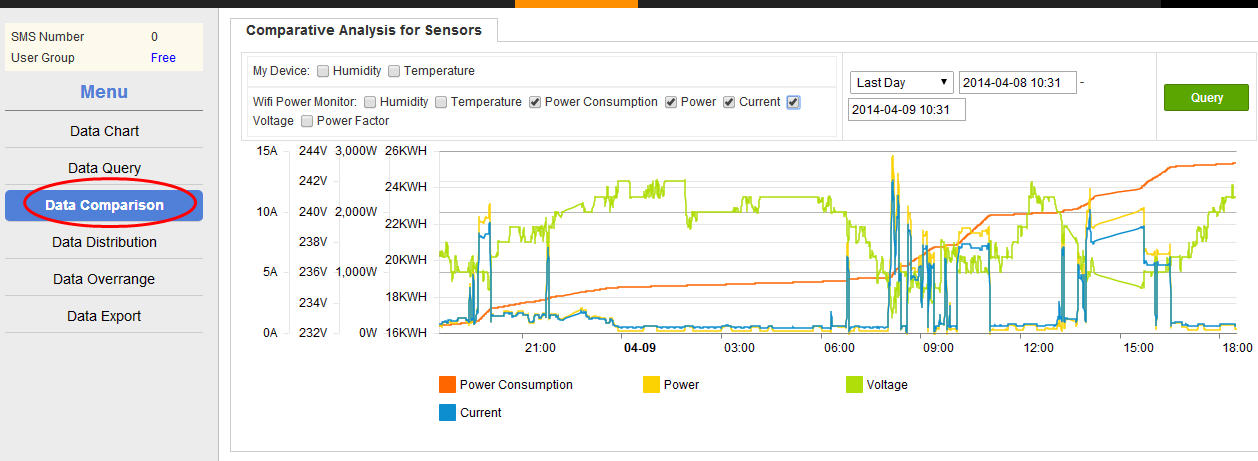
2.3 Data Comparison
You can do comparative analysis between different sensors. Go to Data Report ->Data Comparison. For example, select Power Consumption, Power, Current and Voltage, and the time period; then, right click on Query button. The comparative analysis will be shown below:
[img]http://www.devicebit.com/userfiles/WIFI ... Snap26.jpg[/img]
Data Comparison
2.4 Data Distribution
You can check the data distribution. Go to Data reports ->Data Distribution. You can set the query conditions and the histogram will display.
[img]http://www.devicebit.com/userfiles/WIFI ... Snap27.jpg[/img]
Data Distribution
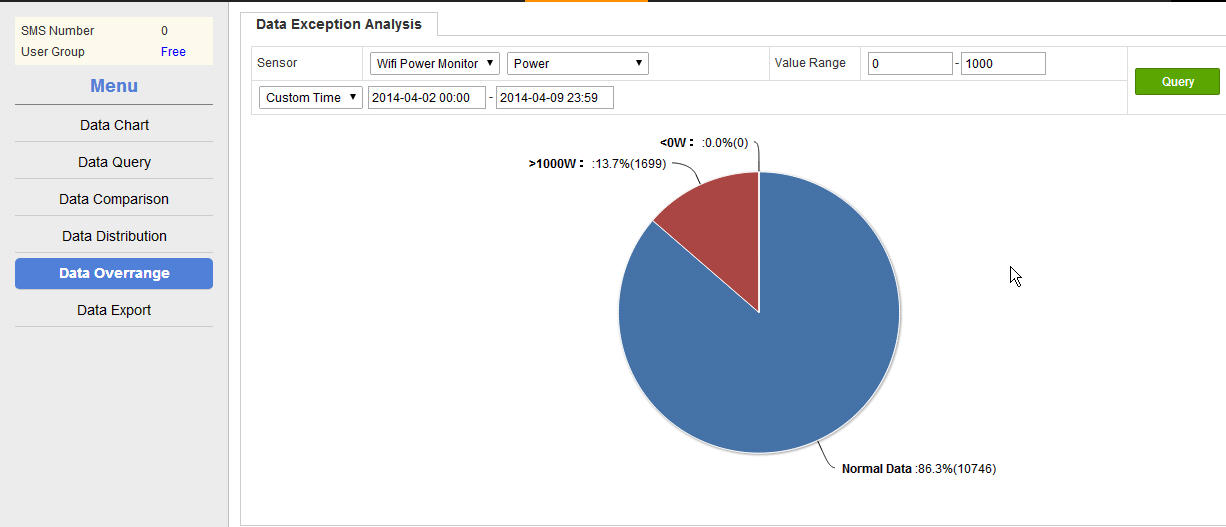
2.5 Data Overrange
You can set the normal range for your devices’ measurement. Go to Data reports ->Data Overrange to query the alarm statistics. Set the query conditions and the result will be displayed by pie chart.
[img]http://www.devicebit.com/userfiles/WIFI ... Snap28.jpg[/img]
Data Overrange
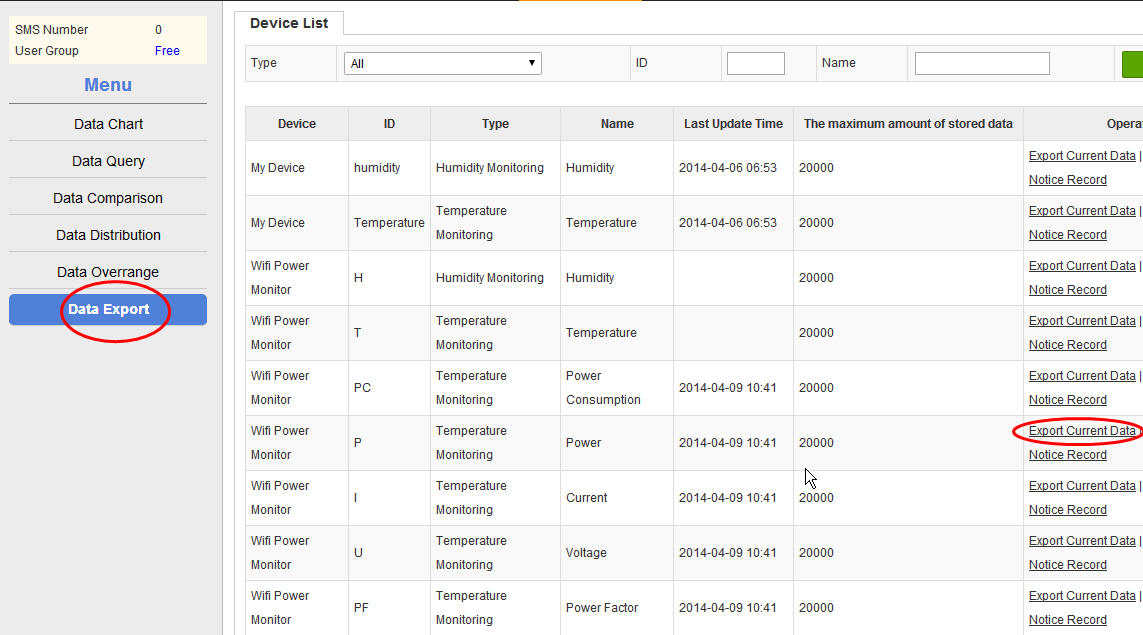
2.6 Data Export
Go to Data Report ->Data Export, click on Export to export the measurement list of specified device to local disk.
[img]http://www.devicebit.com/userfiles/WIFI ... Snap30.jpg[/img]
Data Export
3 IOT Applications
The daily power consumption of your home can be sent to Twitter, and daily or weekly reports can be sent to your E-mail.
The procudures for setting up auto-sending for Twitter or E-mail are as follows,
Sending Twitter or E-mail
DeviceBit platform also provides functions of binding Twitter, or E-mail. The real-time values of your WIFI Power Monitor can be automatically sent to Twitter, or emailed to the specified E-mail address. Twitter content can also be customized according to different measured values. An example of Twitter auto-sending will be illustrated below. The sending mode of E-mail is basically the same. You can select Twitter or email in the final auto-sending settings.
Cases
This case is to broadcast the power consumption of the office by Twitter at different times(8:00am, 14:00 pm, 20:00 pm ). The microblogging content will be different according to different measured values. Please see the following example:
?DeviceBit NOTICE?2014-04-09 14:00,Total Energy 27KWH, Max. Power 3047 W, Min. Power 26W, Average Power 374W (http://www.devicebit.com/u/g/3837)
Setting steps:
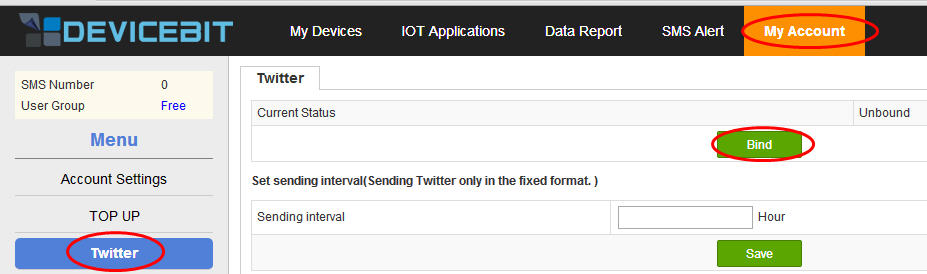
Step 1 Bind Twitter account. First, login to DeviceBit platform, go to My Account ->Twitter
[img]http://www.devicebit.com/UserFiles/WIFI ... Snap48.jpg[/img]
Bind Twitter
Click on Bind, a page will appear as follows:
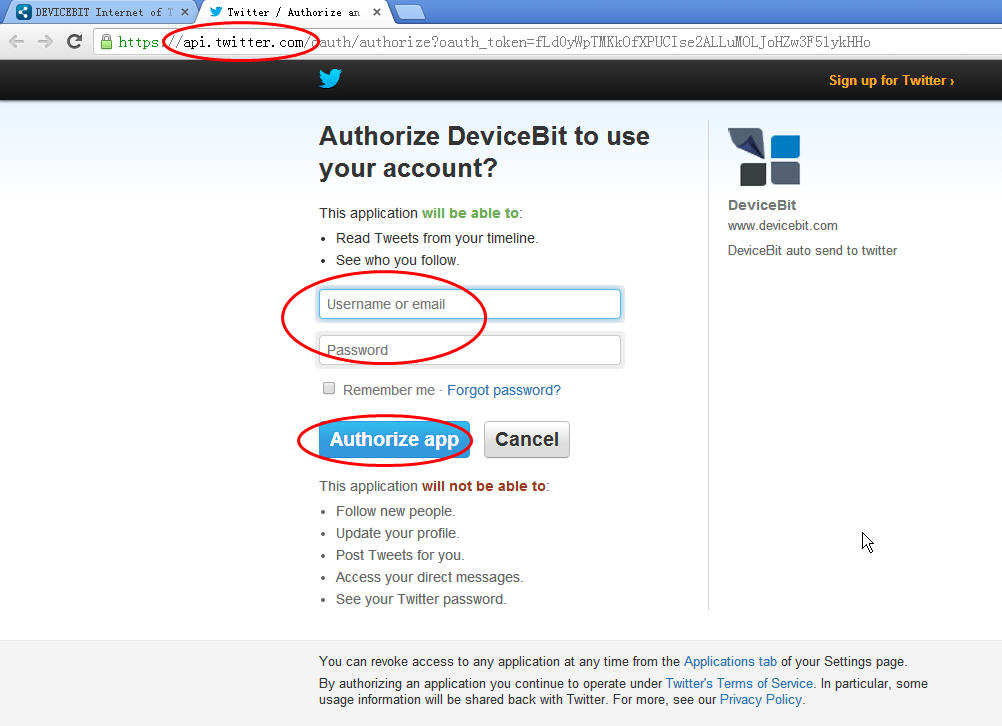
[img]http://www.devicebit.com/UserFiles/WIFI ... Snap49.jpg[/img]
Twitter
Enter your username and password, click on Authorize App and your Twitter account will be successfully binded. Note: If you have already login to Twitter, the system will automatically bind your account, and the login page will not appear. If you want to bind another account, you need to logout your Twitter first and restart IE ??browser before binding.
Note: For account security, the website to bind Twitter is api.twitter.com URL address.
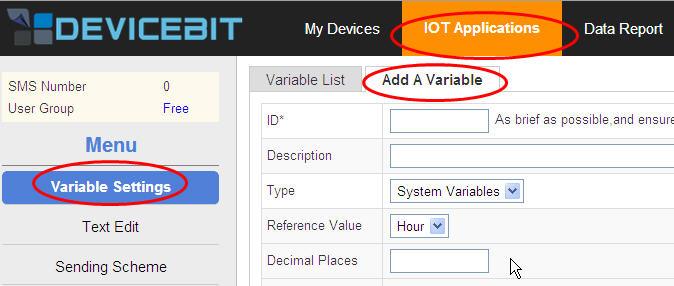
Step 2 Set up variables. Click on IOT applications on the top, go to the menu on the left, and click on Variables Settings. Different Twitter sending content is defined according to different system variables or the measured value range of the sensor.
[img]http://www.devicebit.com/UserFiles/usermanual/25-2.jpg[/img]
Variable Settings
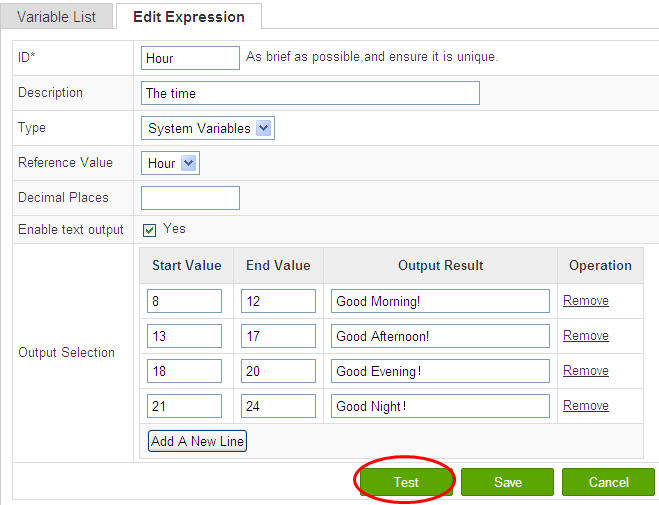
First, set different Twitter content, Good morning, Good afternoon or Good evening according to the system variable Hour. Click on Add Expressions, and fill in the information as follows:
[img]http://www.devicebit.com/UserFiles/usermanual/26-1.jpg[/img]
Hour Settings
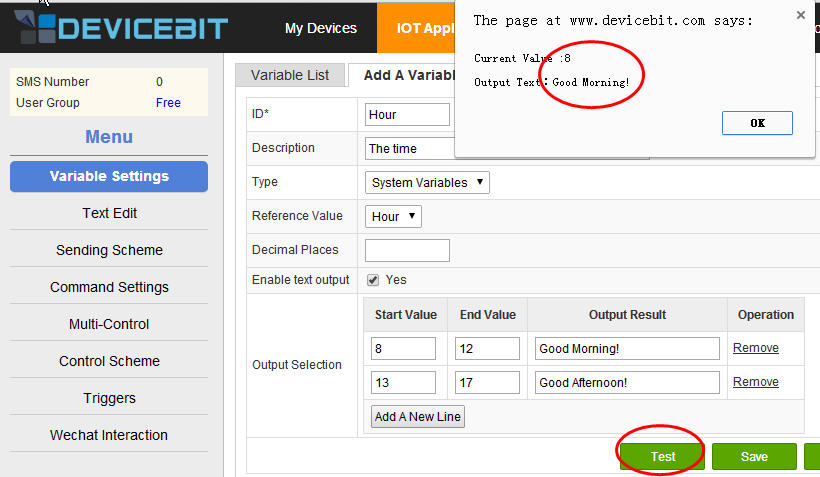
Note for Type select System Variables . The system variables including the hour , date , and time. Select Hour here. Decimal Places leave blank, for decimal is not involved here. Enable output text output tick Yes. Then, click on Test, we can see that the current time is 8 o’clock, and the text is Good Morning! (For the time is at the range 8-12)
[img]http://www.devicebit.com/UserFiles/usermanual/27-2.jpg[/img]
Test For Hour
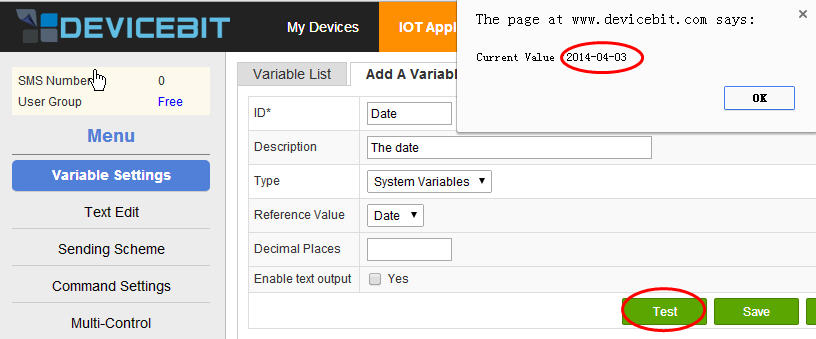
Next, set up Date in the same way. Settings for date are very simple. Ignore Enable text output for there is no need to set it. The settings and test results are as follows:
[img]http://www.devicebit.com/UserFiles/usermanual/28-3.jpg[/img]
Settings &Test For Date
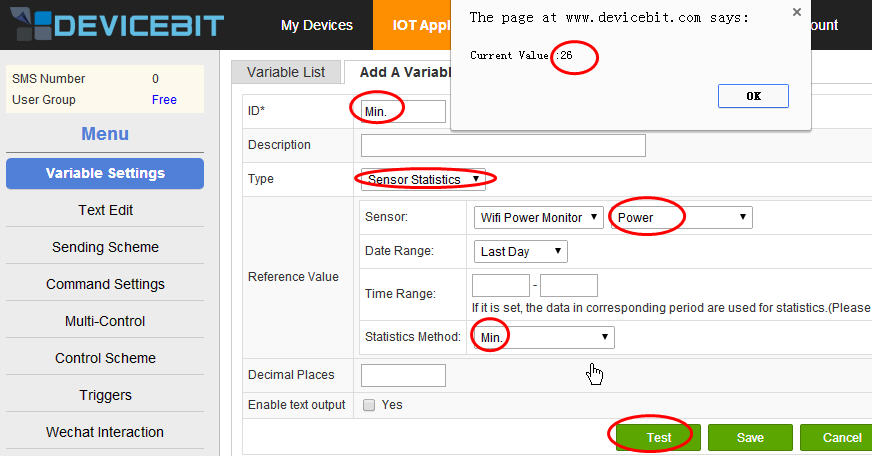
Finally, set the Twitter text according to different measured power values. Here, select Sensor Statistics for Type, select WIFIPower Monitor and Power for Reference Value. Since all the values are integers, the decimal places do not need to be set. If the measured values are decimals, you can set the decimal places here. The format is .0, .00 and so on. Then, click on Test to check the result.
[img]http://www.devicebit.com/UserFiles/WIFI ... Snap32.jpg[/img]
Settings & Test For Average Power
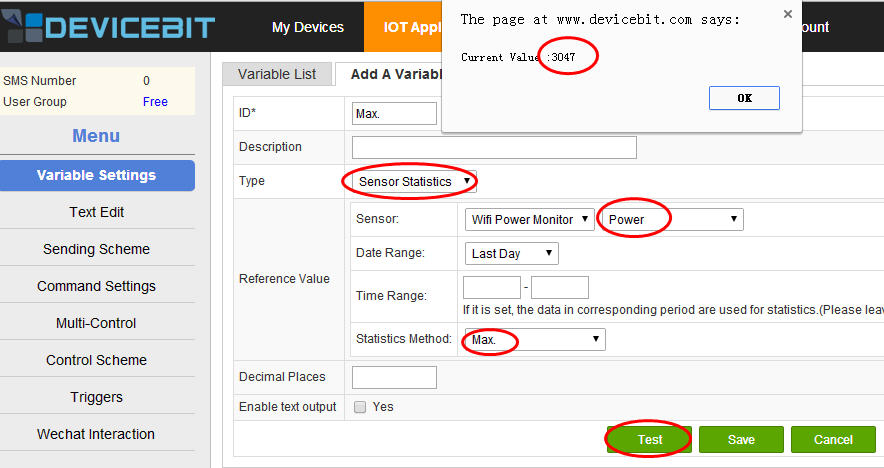
The above settings for variables are complete. Of course, there are more settings for more complex logical relationships. You can select Sensor Statistics for Type, and Max. or Min. and so on for Statistics Method. You can select multiple sensors and do more researches by yourself.
[img]http://www.devicebit.com/UserFiles/WIFI ... Snap33.jpg[/img]
Settings & Test For Max. Power
[img]http://www.devicebit.com/UserFiles/WIFI ... Snap34.jpg[/img]
Settings & Test For Min. Power
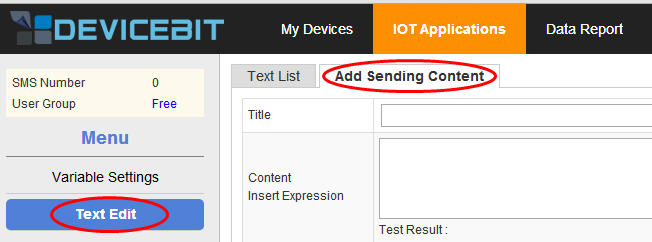
Step 3 Edit text: Click on Text Edit ->Add Sending Content
[img]http://www.devicebit.com/UserFiles/usermanual/31-1.jpg[/img]
Text Edit
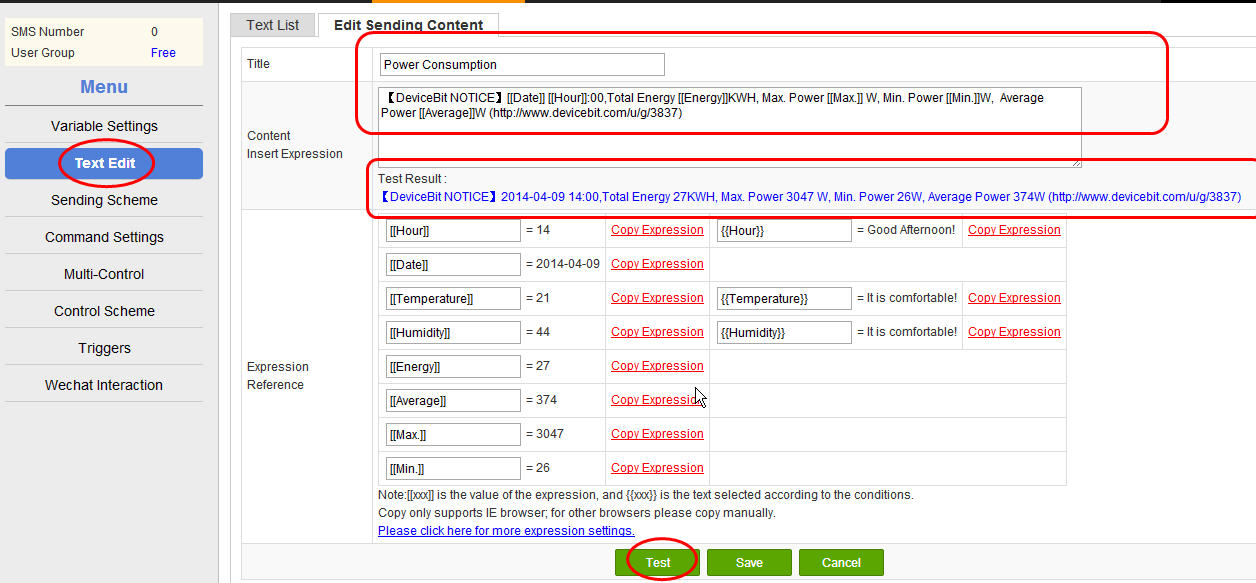
The settings and test result are as follows.
[img]http://www.devicebit.com/UserFiles/WIFI ... Snap37.jpg[/img]
Settings & Test For Text
The returned content for [[ ]] is the returned value of the system variable in [[ ]], the measured value of the sensor in [[ ]], or the more complex logic operation result of the measured values of the sensor in [[ ]]. For example, the returned content for [[date]] is the current date. While, the content for the two braces {{}} is the Twitter Text corresponding with the value range of the variable in {{}}. After setting up, you can click on Test to see whether the settings are correct.
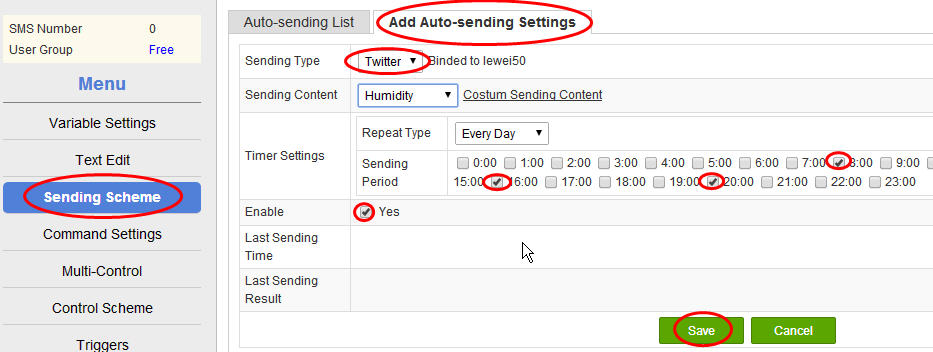
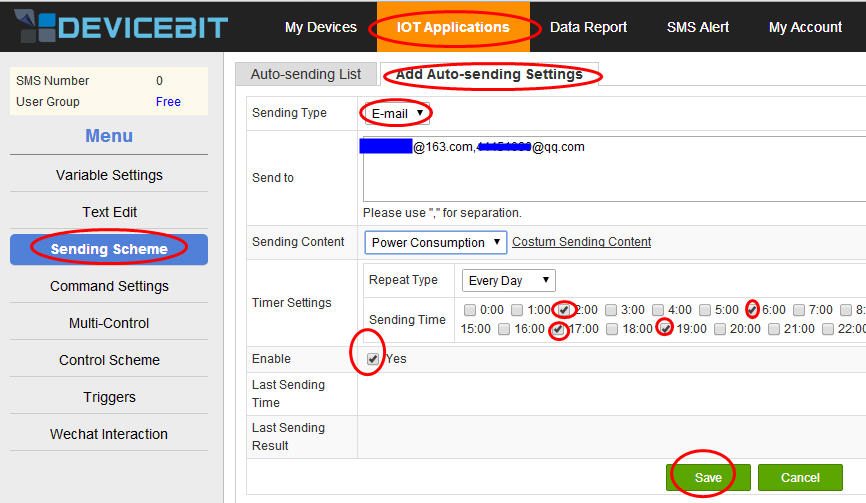
Step 4 Set up auto-sending settings. This step is very simple. Click on Sending Scheme ->Add Auto-sending Settings. SelectTwitter for the Sending Type. Select Every Day for the Repeat Type. Tick the time, for example 8:00, 16:00, and 20:00. Then the text content will be sent to Twitter automatically at 8:00am, 16:00pm, and 20:00pm everyday!
[img]http://www.devicebit.com/UserFiles/user ... 3-1(1).jpg[/img]
Auto-sending Settings For Twitter
The above settings are all completed. Thus, you can see different Twitter sent automatically at the defined time according to different measured values by your Twitter account bound.
The sending mode for E-mail and SMS is the same with Twitter. Just select E-mail or SMS at Add Auto-sending Settings. After selecting, there will be a blank column for you to fill in the E-mail address or mobile phone number.
[img]http://www.devicebit.com/UserFiles/WIFI ... Snap41.jpg[/img]
Auto-sending Settings For E-mail
Trigger
The trigger of DeviceBit is the simple form of IFTTT(IF THIS THEN THAT). Different oprations (E-mail, Twitter, or control unit) can be triggered according to one value or value combination (edge trigger is supported).
You can set trigger of power as the following pictures show.
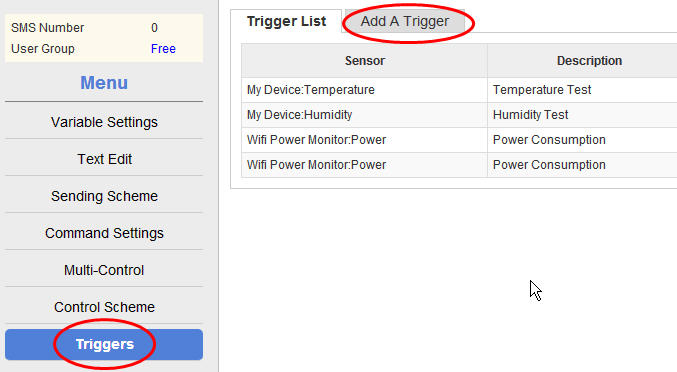
Go to IOT applications -> Triggers ->Add A Trigger
Click on Add A Trigger
[img]http://www.devicebit.com/UserFiles/WIFI ... Snap40.jpg[/img]
Add A Trigger
Then, edit the related information of the trigger.
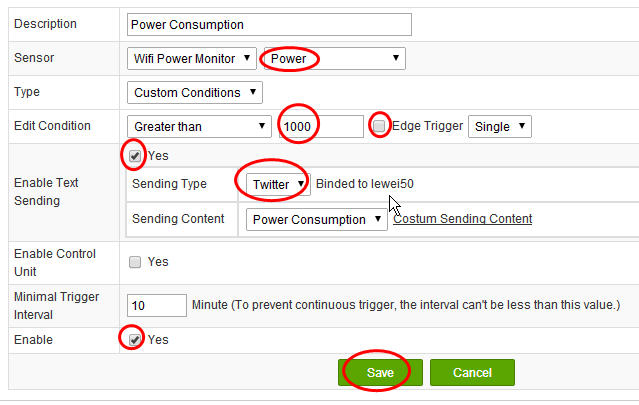
[img]http://www.devicebit.com/UserFiles/WIFI ... Snap47.jpg[/img]
Twitter Trigger
As the above picture shows,
Sensor: select Wifi Power Monitor & Power
Type: select Custome Conditions
Edit Conditon: Greater than 1000 (This means when the power is greater than 1000, the alert will be sent on Twitter by this trigger) , untick Edge Trigger
Enable Text Sending: tick Yes
Sending Type: select Twitter
Sending Content: select Power Consumption
Enable: tick Yes (Then, the trigger is on.)
At last, don't forget to click on Save. Thus, the trigger for twitter is set up.
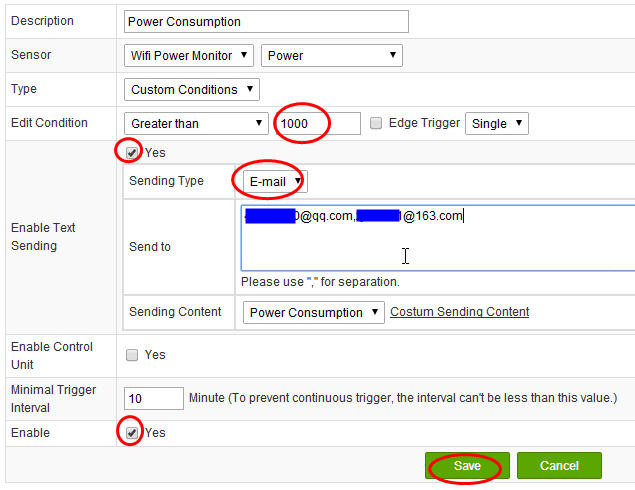
Set up the trigger for E-mail in the same way.
[img]http://www.devicebit.com/UserFiles/WIFI ... Snap42.jpg[/img]
E-mail Trigger
Sending Type: select E-mail, and enter the E-mail addresses.
Thus, the triggers of power are set up, as the above picture shows.
Sending Report Periodically
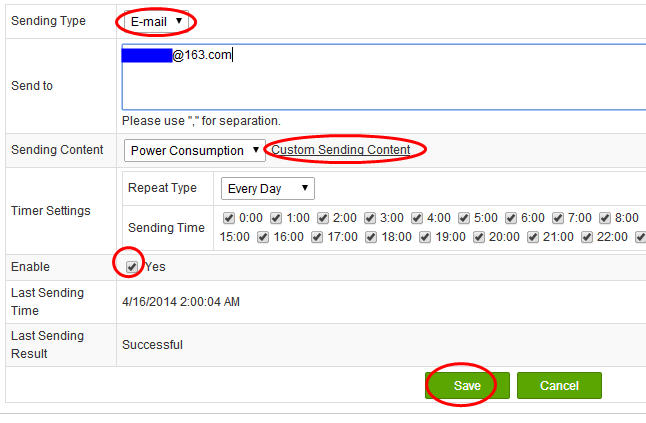
First, select E-mail for Sending Type, and then click on Custom Sending Content
[img]http://www.devicebit.com/UserFiles/user ... Snap95.jpg[/img]
Custom Sending Content
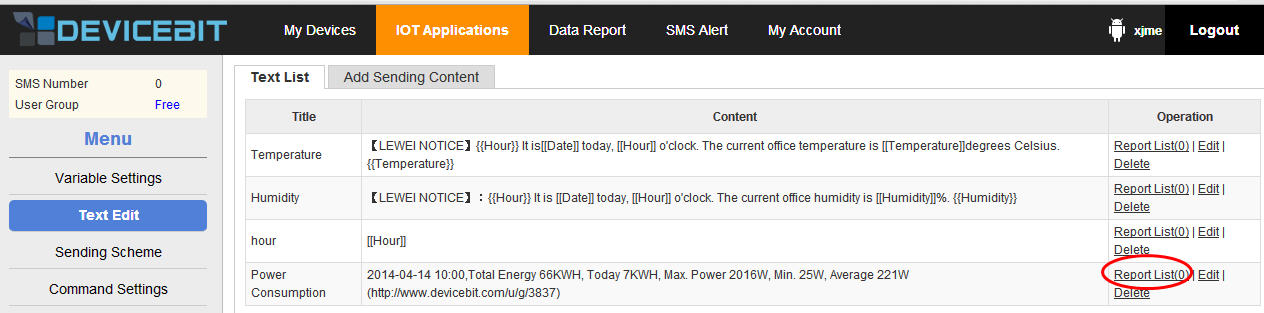
Click on Report List
[img]http://www.devicebit.com/UserFiles/trigger/Snap76.jpg[/img]
Add Report List
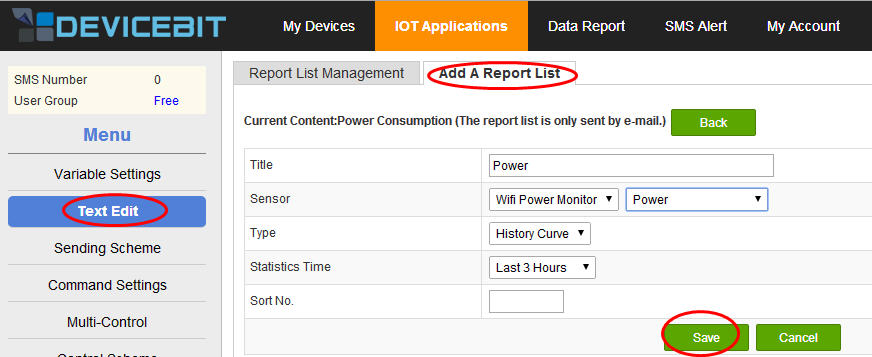
Fill in the related information.
Case: the power of WIFI Power Monitor. We want to sent the report list of power history curve for the last 3 hours.
[img]http://www.devicebit.com/UserFiles/trigger/Snap78.jpg[/img]
Report List Settings
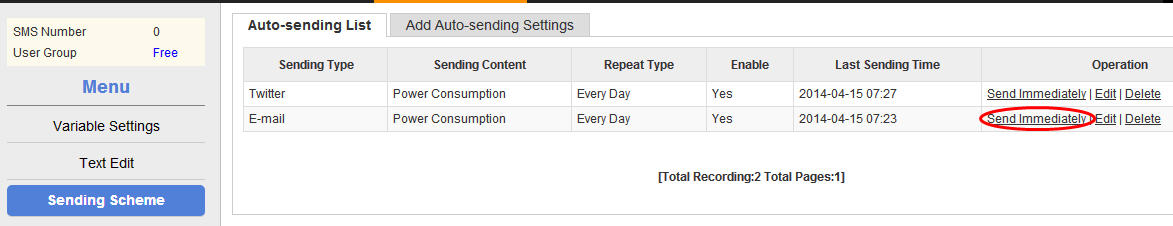
Click on Send Immediately for testing.
[img]http://www.devicebit.com/UserFiles/trigger/Snap82.jpg[/img]
Report List Test
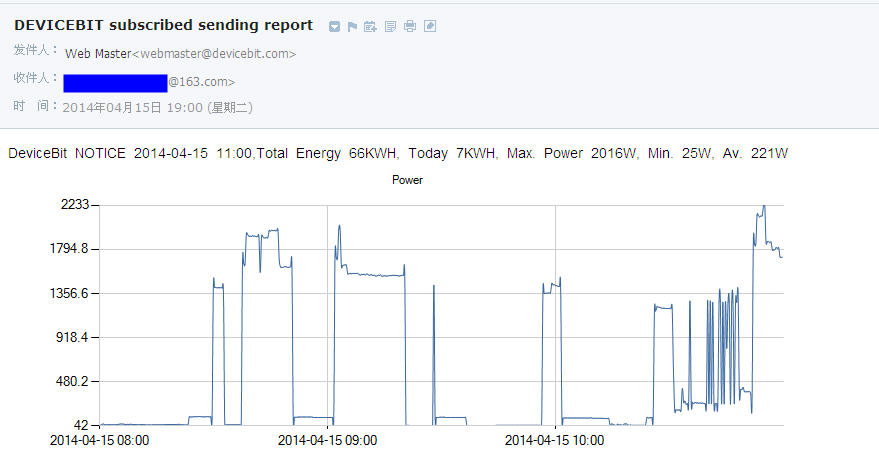
Then, you will receive an E-mail as the following picture shows.
[img]http://www.devicebit.com/UserFiles/trig ... p90(1).jpg[/img]
Report List
Google has done an open-source project about power meter. A study shows that paying attention to power consumption will bring energy reduction by 10-15%. Perhaps these saved energy costs make no change to your life, but if many people pay attention to power consumption, the energy savings will not be a small figure.
A lot of people have done the open source power meter with Arduino, such as
http://openenergymonitor.org/emon/node/58
However, they basically use independent current sensor and voltage sensor to complete the task, using Arduino to read the values of current and voltage, and then calculate the power.
The advantages are: The prices of the current sensor and voltage sensor are very cheap.
The disadvantages are: The power is calculated by the Arduino. If the power of Arduino is cut off, the data are lost. If you need to calculate the energy, you should use Arduino to do integral operation of the power, bringing accumulated error.
Because of these above problems, we use a special power meter module and an Arduino together to calculate electricity energy.
Arduino Power Meter Hardwares
l Arduino UNO+W5100
l URAT-RS485 module
l JSY-109
(Power Meter Module, measuring the current, voltage, power, power consumption independently, and the data can no be lost if the electricity is cut off.)
[img]
[img]http://static.lewei50.com/UserFiles/WIF ... Snap52.jpg[/img]
[img]
Tutorial (Step by Step)
Wire Connection
As the following picture shows:
1. Air Switch at the entrance
2. Current transformer coil of power meter module, clipped on the dfrobot wire of the air switch. Please note the current direction.
3. Voltage transformer of power meter module, connected to 220V power supply (The red light is on if the power is supplied.)
4. TTL-RS485 Module, AB terminal is connected to 485 AB of power meter module.
5. TTL-RS485, TX RX 5V GND is connected to ARDUINO UNO
6. Select UNO with network board (W5100)
[img]http://static.lewei50.com/UserFiles/WIF ... Snap54.jpg[/img]
Download Codes
https://github.com/DevicebitDemo/DeviceBitHttpClient
Download this file to x/Arduino/library (Delete master in the file name)
[img]http://www.devicebit.com/userfiles/WIFI ... Snap67.jpg[/img]
Test for local mode
1. Open Arduino IDE
2. Example -> DeviceBitHttpClient ->JSY109local
3. Compile the codes (Note: Before downloading the codes, disconnect the TX pin and RX pin which connect TTL-RS485 module and the Arduino. Otherwise, the Arduino can not communicate with the power meter. )
4. Close the air switch, and the power is supplied to the power meter. The red light is on.
5. Open the monitor interface of the serial port, and select 4800 baud rates (Because the baud rates of power monitor module is 4800.) The voltage has been tested out, which means the communication between UNO and power meter module is normal.
[img]http://static.lewei50.com/UserFiles/WIF ... Snap56.jpg[/img]
Test for network
First, please register an account on http://www.devicebit.com/home/login
Then, login to devicebit, and add a new device. Note that the ID of the device is 02 (corresponding with the Arduino program). Template: select Wifi Power Monitor.
[img]http://www.devicebit.com/userfiles/WIFI ... Snap63.jpg[/img]
Open Arduino IDE
Example ->DeviceBitHttpClient->JSY109Remote?replace DB_USERKEY with your userkey.
[img]http://[/img]
[img]http://static.lewei50.com/UserFiles/WIF ... Snap58.jpg[/img]
Get your userkey in the user center of DeviceBit My account->Account settings
[img]http://www.devicebit.com/UserFiles/usermanual/17-1.jpg[/img]
Compile the codes (Note: Before downloading the codes, disconnect the TX pin and RX pin which connect TTL-RS485 module and the Arduino. Otherwise, the Arduino can not communicate with the power meter. )
Open the monitor interface of the serial port, and select 4800 baud rates. When you see”Ethernet configuration OK”, the LAN configuration is done!
[img]http://static.lewei50.com/UserFiles/WIF ... Snap59.jpg[/img]
Go back to Real-time Data in the user center of DeviceBit, the sensors of power consumption, power, current, voltage and power factor have been highlighted and have data now(Note the last update time).
[img]http://www.devicebit.com/userfiles/WIFI ... Snap65.jpg[/img]
You can monitor the real-time data by visiting m.devicebit.com via your mobile phone
[img]http://www.devicebit.com/userfiles/WIFI ... Snap66.jpg[/img]
2 Data reports
DeviceBit platform provides basic data-analyzing tools so you can do a series of research based on your data stored in DeviceBit system.
2.1 Data Chart
Go to Data Report ->Data Chart. You can right click on Query button to view the latest data curve. You can select the device and time period.
[img]http://www.devicebit.com/userfiles/WIFI ... Snap24.jpg[/img]
Data Chart
2.2 Data Query
You can also query the historical data by lists. Go to Data reports ->Data Query. You can select the device and other conditions. The data can be exported in Excel.
[img]http://www.devicebit.com/userfiles/WIFI ... Snap25.jpg[/img]
Data Query
2.3 Data Comparison
You can do comparative analysis between different sensors. Go to Data Report ->Data Comparison. For example, select Power Consumption, Power, Current and Voltage, and the time period; then, right click on Query button. The comparative analysis will be shown below:
[img]http://www.devicebit.com/userfiles/WIFI ... Snap26.jpg[/img]
Data Comparison
2.4 Data Distribution
You can check the data distribution. Go to Data reports ->Data Distribution. You can set the query conditions and the histogram will display.
[img]http://www.devicebit.com/userfiles/WIFI ... Snap27.jpg[/img]
Data Distribution
2.5 Data Overrange
You can set the normal range for your devices’ measurement. Go to Data reports ->Data Overrange to query the alarm statistics. Set the query conditions and the result will be displayed by pie chart.
[img]http://www.devicebit.com/userfiles/WIFI ... Snap28.jpg[/img]
Data Overrange
2.6 Data Export
Go to Data Report ->Data Export, click on Export to export the measurement list of specified device to local disk.
[img]http://www.devicebit.com/userfiles/WIFI ... Snap30.jpg[/img]
Data Export
3 IOT Applications
The daily power consumption of your home can be sent to Twitter, and daily or weekly reports can be sent to your E-mail.
The procudures for setting up auto-sending for Twitter or E-mail are as follows,
Sending Twitter or E-mail
DeviceBit platform also provides functions of binding Twitter, or E-mail. The real-time values of your WIFI Power Monitor can be automatically sent to Twitter, or emailed to the specified E-mail address. Twitter content can also be customized according to different measured values. An example of Twitter auto-sending will be illustrated below. The sending mode of E-mail is basically the same. You can select Twitter or email in the final auto-sending settings.
Cases
This case is to broadcast the power consumption of the office by Twitter at different times(8:00am, 14:00 pm, 20:00 pm ). The microblogging content will be different according to different measured values. Please see the following example:
?DeviceBit NOTICE?2014-04-09 14:00,Total Energy 27KWH, Max. Power 3047 W, Min. Power 26W, Average Power 374W (http://www.devicebit.com/u/g/3837)
Setting steps:
Step 1 Bind Twitter account. First, login to DeviceBit platform, go to My Account ->Twitter
[img]http://www.devicebit.com/UserFiles/WIFI ... Snap48.jpg[/img]
Bind Twitter
Click on Bind, a page will appear as follows:
[img]http://www.devicebit.com/UserFiles/WIFI ... Snap49.jpg[/img]
Enter your username and password, click on Authorize App and your Twitter account will be successfully binded. Note: If you have already login to Twitter, the system will automatically bind your account, and the login page will not appear. If you want to bind another account, you need to logout your Twitter first and restart IE ??browser before binding.
Note: For account security, the website to bind Twitter is api.twitter.com URL address.
Step 2 Set up variables. Click on IOT applications on the top, go to the menu on the left, and click on Variables Settings. Different Twitter sending content is defined according to different system variables or the measured value range of the sensor.
[img]http://www.devicebit.com/UserFiles/usermanual/25-2.jpg[/img]
Variable Settings
First, set different Twitter content, Good morning, Good afternoon or Good evening according to the system variable Hour. Click on Add Expressions, and fill in the information as follows:
[img]http://www.devicebit.com/UserFiles/usermanual/26-1.jpg[/img]
Hour Settings
Note for Type select System Variables . The system variables including the hour , date , and time. Select Hour here. Decimal Places leave blank, for decimal is not involved here. Enable output text output tick Yes. Then, click on Test, we can see that the current time is 8 o’clock, and the text is Good Morning! (For the time is at the range 8-12)
[img]http://www.devicebit.com/UserFiles/usermanual/27-2.jpg[/img]
Test For Hour
Next, set up Date in the same way. Settings for date are very simple. Ignore Enable text output for there is no need to set it. The settings and test results are as follows:
[img]http://www.devicebit.com/UserFiles/usermanual/28-3.jpg[/img]
Settings &Test For Date
Finally, set the Twitter text according to different measured power values. Here, select Sensor Statistics for Type, select WIFIPower Monitor and Power for Reference Value. Since all the values are integers, the decimal places do not need to be set. If the measured values are decimals, you can set the decimal places here. The format is .0, .00 and so on. Then, click on Test to check the result.
[img]http://www.devicebit.com/UserFiles/WIFI ... Snap32.jpg[/img]
Settings & Test For Average Power
The above settings for variables are complete. Of course, there are more settings for more complex logical relationships. You can select Sensor Statistics for Type, and Max. or Min. and so on for Statistics Method. You can select multiple sensors and do more researches by yourself.
[img]http://www.devicebit.com/UserFiles/WIFI ... Snap33.jpg[/img]
Settings & Test For Max. Power
[img]http://www.devicebit.com/UserFiles/WIFI ... Snap34.jpg[/img]
Settings & Test For Min. Power
Step 3 Edit text: Click on Text Edit ->Add Sending Content
[img]http://www.devicebit.com/UserFiles/usermanual/31-1.jpg[/img]
Text Edit
The settings and test result are as follows.
[img]http://www.devicebit.com/UserFiles/WIFI ... Snap37.jpg[/img]
Settings & Test For Text
The returned content for [[ ]] is the returned value of the system variable in [[ ]], the measured value of the sensor in [[ ]], or the more complex logic operation result of the measured values of the sensor in [[ ]]. For example, the returned content for [[date]] is the current date. While, the content for the two braces {{}} is the Twitter Text corresponding with the value range of the variable in {{}}. After setting up, you can click on Test to see whether the settings are correct.
Step 4 Set up auto-sending settings. This step is very simple. Click on Sending Scheme ->Add Auto-sending Settings. SelectTwitter for the Sending Type. Select Every Day for the Repeat Type. Tick the time, for example 8:00, 16:00, and 20:00. Then the text content will be sent to Twitter automatically at 8:00am, 16:00pm, and 20:00pm everyday!
[img]http://www.devicebit.com/UserFiles/user ... 3-1(1).jpg[/img]
Auto-sending Settings For Twitter
The above settings are all completed. Thus, you can see different Twitter sent automatically at the defined time according to different measured values by your Twitter account bound.
The sending mode for E-mail and SMS is the same with Twitter. Just select E-mail or SMS at Add Auto-sending Settings. After selecting, there will be a blank column for you to fill in the E-mail address or mobile phone number.
[img]http://www.devicebit.com/UserFiles/WIFI ... Snap41.jpg[/img]
Auto-sending Settings For E-mail
Trigger
The trigger of DeviceBit is the simple form of IFTTT(IF THIS THEN THAT). Different oprations (E-mail, Twitter, or control unit) can be triggered according to one value or value combination (edge trigger is supported).
You can set trigger of power as the following pictures show.
Go to IOT applications -> Triggers ->Add A Trigger
Click on Add A Trigger
[img]http://www.devicebit.com/UserFiles/WIFI ... Snap40.jpg[/img]
Add A Trigger
Then, edit the related information of the trigger.
[img]http://www.devicebit.com/UserFiles/WIFI ... Snap47.jpg[/img]
Twitter Trigger
As the above picture shows,
Sensor: select Wifi Power Monitor & Power
Type: select Custome Conditions
Edit Conditon: Greater than 1000 (This means when the power is greater than 1000, the alert will be sent on Twitter by this trigger) , untick Edge Trigger
Enable Text Sending: tick Yes
Sending Type: select Twitter
Sending Content: select Power Consumption
Enable: tick Yes (Then, the trigger is on.)
At last, don't forget to click on Save. Thus, the trigger for twitter is set up.
Set up the trigger for E-mail in the same way.
[img]http://www.devicebit.com/UserFiles/WIFI ... Snap42.jpg[/img]
E-mail Trigger
Sending Type: select E-mail, and enter the E-mail addresses.
Thus, the triggers of power are set up, as the above picture shows.
Sending Report Periodically
First, select E-mail for Sending Type, and then click on Custom Sending Content
[img]http://www.devicebit.com/UserFiles/user ... Snap95.jpg[/img]
Custom Sending Content
Click on Report List
[img]http://www.devicebit.com/UserFiles/trigger/Snap76.jpg[/img]
Add Report List
Fill in the related information.
Case: the power of WIFI Power Monitor. We want to sent the report list of power history curve for the last 3 hours.
[img]http://www.devicebit.com/UserFiles/trigger/Snap78.jpg[/img]
Report List Settings
Click on Send Immediately for testing.
[img]http://www.devicebit.com/UserFiles/trigger/Snap82.jpg[/img]
Report List Test
Then, you will receive an E-mail as the following picture shows.
[img]http://www.devicebit.com/UserFiles/trig ... p90(1).jpg[/img]
Report List
